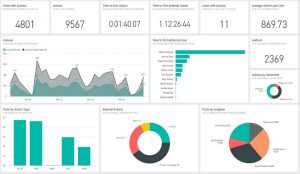
Sage 100Cloud Dashboard
New Data Visualization
Are you looking for new ways to slice, dice and visualize data and to share your discoveries for your Sage 100Cloud with your business team? Discover Sage 100Cloud Dashboard because Microsoft Power BI is a powerful tool and we can help you get where you want to. This new collection of tools and features from Microsoft transforms your company’s data into rich visuals for you to collect and organize, so you can spot trends, collaborate in new ways, and make sense of your data by using Sage Intelligence with Microsoft Power BI.
All business need comprehensive data analytics solutions to gain insights into business operations and financial performance. It is an importance for your business to be able to review this data and have an analysis process with analytics charts and reports including this data giving knowledge and measurable KPI’s. These are the primary data tables you need to understand in Sage 100 Accounting Software and we can help you discover them or design and create the dashboards for you.
- Master lists
- Data entry
- History
- Work tables
Accounting Business Solutions by JCS’s Microsoft Power BI Consulting Services our team wants to be part of your team so we can grow together and we are a perfect match to help you with your data visualization needs using Sage 100cloud dashboard. We can help you quickly view your complicated and piles of data and get the information you need to make business decisions. Once created these types of dashboards can present data very quickly and provide you a complete view of your information in an easily understandable format using an interactive data visualization tool. Specializing in Sage 100, Sage Intelligence and Microsoft Power BI services.
Sage 100Cloud Dashboard – Providing Sage 100Cloud support, Sage Intelligence consulting services and Mircosoft Power BI design and implementation. Give us a call 800-475-1047 or email at solutions@jcscomputer.com
For Sage Intelligence Questions and Answers
Where to access File Layouts information (field and table schema) or the TRSG (Technical Reference and Support Guide) for Sage 100 ERP.
Versions 2018 and later
From the Sage 100 ERP Desktop, click Web Content in the bottom left-hand corner
In the Web Content Navigation Task pane that appears, click Resources
Under Program Information, click File Layouts and Program Information
In the File Layouts and Program Information window that appears, select any of the help topics, which are listed below.
Program Listings
File and Table Listings
File Layouts (Open this to see file layouts organized by module and table name)
Object Hierarchy Listings
Data Class Definitions Listing
File Names and Key Information (Legacy Only)
Cross Reference Information (This topic also includes Old File Names to New File Names Mapping and Old Field Names to New Field Names Mapping.
Object Reference
Prior to version 2018
From the Sage 100 ERP Desktop, click the View menu, then click Tasks
In the Tasks pane, under Sage 100 ERP, click Resources.
In the Resources window, click File Layouts and Program Information.
In the File Layouts and Program Information window that appears, select any of the help topics, which are listed below.
Program Listings
File and Table Listings
File Layouts (Open this to see file layouts organized by module and table name)
Data Class Definitions Listing
File Names and Key Information (Legacy Only)
Cross Reference Information (This topic also includes Old File Names to New File Names Mapping and Old Field Names to New Field Names Mapping.
Object Reference
Note: Prior to Sage 100 ERP (formerly Sage MAS 90 and 200) version 4.00, File Layouts information was available on disc, in a TRSG (Technical Reference and Support Guide) CD-ROM
Sage Intelligence requirements
- Sage Intelligence must be installed as the Network Administrator.
- Excel must be installed and activated prior to the Sage Intelligence installation.
- Excel must be closed during installation of Sage Intelligence (also check that there are no remaining EXCEL.EXE processes listed in the Windows Task Manager-Processes tab)
What is the Sage Intelligence Report Utility?
The Sage Intelligence Report Utility is a tool that you can download from our website, which will enable you to automatically import any of the additional free Sage Intelligence reports.
How does the Sage 100 Sage Intelligence Report Utility work?
The Report Utility detects which Sage accounting or business management solution you are running and will show all the available free reports for your solution. You can then select the required reports to be automatically imported into a “New Reports” folder in the Sage Intelligence Report Manager for immediate use. Once you have installed the Report Utility, a shortcut will appear on your desktop, allowing you instant access to our regularly updated library of free reports.
Do I need to download the Sage 100 Sage Intelligence installer every time I want to check for updated reports?
No. You will only need to download the installer once and thereafter you can simply open the Report Utility from your desktop, showing you all the reports available to you.
Can I still download the reports without using the utility?
Yes. These reports may be still available on the Free Reports Group, although you will have to manually download and import each report individually into your Report Manager.
Does a customer have to be on the current version of Sage Intelligence Reporting to use this? Or could a very old Sage Intelligence Reporting version work with this Report Utility?
The Report Utility is compatible with the latest version of Sage Intelligence Reporting, but has not being tested on previous versions. You can however manually access these reports on the Free Reports Group on the Sage Intelligence Community.
Where will I find all the new reports that I have downloaded into the Report Manager?
There will be a new folder automatically added to your Report Manager folders called “New Reports”.
What version of Microsoft® Excel® does the Report Utility support?
Microsoft® Excel® 2010 +
What Sage Solutions are currently catered for?
Sage 50 US 2016, Sage Pastel V14, Sage Evolution V7, Sage 100 2016 (Std & Advanced), Sage 500 ERP 2016, Sage X3, Sage 100 Contractor US & Canadian Edition (v19.6).
How will I know which reports I don’t yet have?
The Report utility does a check against the reports in your Report Manager. Any reports that you do not have in your Report Manager will be selected. You can choose to download the selected reports or choose the unselect all option and then choose the specific reports you are wanting.
What happens if I mistakenly download the same report twice?
The report will be imported into your Report Manager twice, so you will need to delete the duplicate copy of the report.
How do I delete a report in the Report Manager?
Select the report you would like to delete, right click and select delete.
Can I rename these reports?
Yes. To rename the report, right click on the report and select rename. You will then type in what you would like to call the report and select the ok button.
Can I customize these reports?
Yes. To customize a report, we recommend you first take a copy of the report. Run out the copy report and make your changes in Microsoft Excel, and once complete right-click on the report in the Report Manager and choose to Save Excel Template.
Can I share these reports with other people?
If the user has a Sage Intelligence Report manager license we recommend that you share the link to the Report Utility with them. This way they will also have access to the free reports. Alternatively you could also use the normal export and import function of Sage Intelligence Reporting to share the report with others. If you would like to share the report with non-Sage Intelligence users then you would simply share the Excel workbook as per usual.
Can I request reports to be written?
If you can’t find the report you are looking for, we’d love to hear about your report ideas. Reports are are prioritised based on the number of requests received per idea/suggestion, ensuring that customers get what they need, when they need it.
Are there any pre-requisites to using the Sage 100 Sage Intelligence Report Utility?
- Sage Accounting/BMS solution
- Sage Intelligence Report Manager
- .NET Framework 4.5 (this is automatically installed if you don’t have it)
- Excel 2010+
If I am running two or more Sage Intelligence solutions on my machine how will the Utility work?
When you running the Installer, you will be prompted to say which Sage solution you would like to run it on.
Key functionality
Sage 100 Intelligence Reporting offers you four modules for purchase depending on your reporting requirements:
- Sage 100 Report Viewer
Run existing reports, in real time, when you want them.
- Sage 100 Report Manager
The Report Manager license allows you to do everything the Report Viewer does, plus it allows you to edit and customize your standard report templates and save them for future use, create new reports, sort drill-down and aggregate your data, and automate the distribution of your reports. Note: Sage 100 Business Care customers receive one Report Manager license for free.
- Sage 100 Report Designer
The Report Designer has revolutionized financial reporting! It gives you two methods to create and control your financial reports depending on your Excel knowledge and your unique business requirements.
- Sage 100 Connector
The Connector enables you to access and consolidate information from multiple sources.
Sage Intelligence for Accounting
Feature Updates
Sage 100 Sage Intelligence requirements
- Sage Intelligence must be installed as the Network Administrator.
- Excel must be installed and activated prior to the Sage Intelligence installation.
- Excel must be closed during installation of Sage Intelligence (also check that there are no remaining EXCEL.EXE processes listed in the Windows Task Manager-Processes tab)
Excel Financial Functions for Sage Intelligence Quick Reference Guide
NPER function: Returns the number of periods for an investment
Syntax: NPER(rate, pmt, pv, [fv], [type])
Syntax Example: NPER(6%/12 (rate), -175 (pmt), 10000 (pv))
The Excel NPER function calculates the number of periods required to pay off a loan, for a specified constant periodic payment
and a constant interest rate.
FV function: Returns the future value of an investment
Syntax: FV(rate,nper,pmt,[pv],[type])
Syntax Example: FV(11%/12 (rate), 3 years *12 (nper), -1500 (pmt),)
The Excel FV function calculates the future value of an investment with periodic constant payments and a constant interest rate.
PMT function: Returns the periodic payment for an annuity.
Syntax: PMT(rate, nper, pv, [fv], [type])
Syntax Example: PMT(10%/12 (rate),5 years *12 (nper), 100000 (pv))
The Excel PMT function calculates the constant periodic payment required to pay off (or partially pay off) a loan or investment,
with a constant interest rate, over a specified period.
IPMT function: Returns the interest payment for an investment for a given period
Syntax: IPMT(rate,per,nper,pv,[fv],[type])
Syntax Example: IPMT(8%/12 (rate), 4 (per),7 years *12 (nper), 50000 (pv))
The Excel IPMT function calculates the interest payment, during a specific period of a loan or investment that is paid in constant
periodic payments, with a constant interest rate.
NETWORKDAYS function: Returns the number of working days between a start and end date
Syntax: NETWORKDAYS(start_date, end_date, [holidays])
Syntax Example: NETWORKDAYS(01/01/2012 (start_date), 31/01/2012(end_date), 01/01/2012 [holidays])
Returns the number of whole working days between a start and an end date. Working days excludes weekends (Saturday and
Sunday) and any dates identified as holidays. Can be used to calculate the number of days per month, or the start of one month
and the end of another.
NETWORKDAYS.INTL function: Returns the number of working days between a start and end date, allowing for
different specified weekend options
Syntax: NETWORKDAYS.INTL(Start_date, end_date, [weekend], [holidays])
Syntax Example: NETWORKDAYS.INTL(01/01/2012 (start_date), 31/01/2012(end_date), 3 [weekend], 01/01/2012[holidays])
Returns the number of whole workdays between two dates using parameters to indicate which and how many days are weekend
days. Weekend days and any days that are specified as holidays are not considered as workdays. Can use a specific number to
identify the combination of consecutive days (e.g. 3 = Monday and Tuesday), or a string of 0’s and 1’s to identify non-sequential
days (e.g. 0010100 = Wednesday and Friday).
PV function: Returns the present value of an investment
Syntax: PV(rate, nper, pmt, [fv], [type])
Sytnax Example: PV(8%/12 (rate), 8 years*12 (nper), -5000 (pmt))
The Excel PV function calculates the Present Value of an investment, based on a series of future payments
SLN function: Returns the straight-line depreciation of an asset for one period
Syntax: SLN(Cost, salvage, life)
Syntax Example: SLN(10000 (cost), 1000 (salvage), 5 (life))
The Excel SLN function calculates the straight line depreciation of an asset for one period
Excel Financial Functions
Quick Reference Guide
Weekly Excel Tips: www.alchemex.com/blog/excel-tips-tricks/
DOLLARDE function: Converts a dollar price, expressed as a fraction, into a dollar price, expressed as a decimal number
Syntax: DOLLARDE(fractional_dollar, fraction)
Syntax Example: DOLLARDE(
Converts a dollar price expressed as an integer part and a fraction part, such as 1.02, into a dollar price expressed as a decimal
number. Fractional dollar numbers are sometimes used for security prices.
DOLLARFR function: Converts a dollar price, expressed as a decimal number, into a dollar price, expressed as a fraction
Syntax: DOLLARFR(decimal_dollar, fraction)
Syntax Example: DOLLARFR(1.09235 (decimal_dollar), 32 (fraction))
The Excel DOLLARFR function converts a dollar value in decimal notation into a fractional notation. The DOLLARFR and DOLLARDE
functions are designed for working with security prices, which are often quoted as fractional values.
CUMIPMT function: Returns the cumulative interest paid between two periods
Syntax: CUMIPMT(rate, nper, pv, start_period, end_period, type)
Syntax Example: CUMIPMT(5%/12 (rate),6 years * 12 (nper), 100000 (pv), 1 ( start_period), 12 (end_period, 0 (type)
The Excel CUMIPMT function calculates the cumulative interest paid on a loan or investment, between two specified periods.
CUMPRINC function: Returns the cumulative principal paid on a loan between two periods
Syntax: CUMPRINC(rate, nper, pv, start_period, end_period, type)
Syntax Example: CUMPRINC(5%/12 (rate),6 years * 12 (nper), 100000 (pv), 1 ( start_period), 12 (end_period, 0 (type)
The Excel CUMPRINC function calculates the cumulative payment on the principal of a loan or investment, between two specified
periods.
DB function: Returns the depreciation of an asset for a specified period by using the fixed-declining balance method
Syntax: DB(cost, salvage, life, period, [month])
Syntax Example: DB(15000 (cost), 1500 (salvage), 5 (life), 1 (period))
The Excel DB function calculates the depreciation of an asset, using the Fixed Declining Balance Method, for each period of the
asset’s lifetime.
DDB function: Returns the depreciation of an asset for a specified period by using the double-declining balance method or some
other method that you specify
Syntax: DB(cost, salvage, life, period, [factor])
Syntax Example: DB(12000 (cost), 1200 (salvage), 3 (life), 1 (period))
The Excel DB function calculates the depreciation of an asset, using the Double Declining Balance Method, or another specified
depreciation rate.
EFFECT function: Returns the effective annual interest rate
Syntax: EFFECT(nominal_rate, npery)
Syntax Example: EFFECT(10% (nominal_rate, 4 (npery)
The Excel EFFECT function returns the effective annual interest rate for a given nominal interest rate and number of compounding
periods per year. The NPERY parameter refers to the number of compounding periods per year.
General Program Shortcuts
Excel Keyboard Shortcuts.
Ctrl+N: Create a new workbook
Ctrl+O: Open an existing workbook
Ctrl+S: Save a workbook
F12: Open the Save As dialog box
Ctrl+W: Close a workbook
Ctrl+F4: Close Excel
F4: Repeat the last command or action. For example, if the last thing you typed in a cell is “hello,” or if you change the font color, clicking another cell and pressing F4 repeats that action in the new cell.
Shift+F11: Insert a new worksheet
Ctrl+Z: Undo an action
Ctrl+Y: Redo an action
Ctrl+F2: Switch to Print Preview
F1: Open the Help pane
Alt+Q: Go to the “Tell me what you want to do” box
F7: Check spelling
F9: Calculate all worksheets in all open workbooks
Shift+F9: Calculate active worksheets
Alt or F10: Turn key tips on or off
Ctrl+F1: Show or hide the ribbon
Ctrl+Shift+U: Expand or collapse the formula bar
Ctrl+F9: Minimize the workbook window
F11: Create a bar chart based on selected data (on a separate sheet)
Alt+F1: Create an embedded bar chart based on select data (same sheet)
Ctrl+F: Search in a spreadsheet, or use Find and Replace
Alt+F: Open the File tab menu
Alt+H: Go to the Home tab
Alt+N: Open the Insert tab
Alt+P: Go to the Page Layout tab
Alt+M: Go to the Formulas tab
Alt+A: Go to the Data tab
Alt+R: Go to the Review tab
Alt+W: Go to the View tab
Alt+X: Go to the Add-ins tab
Alt+Y: Go to the Help tab
Ctrl+Tab: Switch between open workbooks
Shift+F3: Insert a function
Alt+F8: Create, run, edit, or delete a macro
Alt+F11: Open the Microsoft Visual Basic For Applications Editor
Moving Around in a Worksheet or Cell
You can use keyboard shortcuts to easily navigate throughout your worksheet, within a cell, or throughout your entire workbook.
- Left/Right Arrow: Move one cell to the left or right
- Ctrl+Left/Right Arrow: Move to the farthest cell left or right in the row
- Up/Down Arrow: Move one cell up or down
- Ctrl+Up/Down Arrow: Move to the top or bottom cell in the column
- Tab: Go to the next cell
- Shift+Tab: Go to the previous cell
- Ctrl+End: Go to the most bottom right used cell
- F5: Go to any cell by pressing F5 and typing the cell coordinate or cell name.
- Home: Go to the leftmost cell in the current row (or go to the beginning of the cell if editing a cell)
- Ctrl+Home: Move to the beginning of a worksheet
- Page Up/Down: Move one screen up or down in a worksheet
- Alt+Page Up/Down: Move one screen to the right or left in a worksheet
- Ctrl+Page Up/Down: Move to the previous or next worksheet
Selecting Cells
You may have noticed from the previous section you use the arrow keys to move between cells, and the Ctrl key to modify that movement. Using the Shift key to modify the arrow keys lets you extend your selected cells. There are also a few other combos for speeding up selection, as well.
- Shift+Left/Right Arrow: Extend the cell selection to the left or right
- Shift+Space: Select the entire row
- Ctrl+Space: Select the entire column
- Ctrl+Shift+Space: Select the entire worksheet
Learn How to Edit a cell using Sage Intelligence
- Shift+F2: Add or edit a cell comment
- Ctrl+X: Cut contents of a cell, selected data, or selected cell range
- Ctrl+C or Ctrl+Insert: Copy contents of a cell, selected data, or selected cell range
- Ctrl+V or Shift+Insert: Paste contents of a cell, selected data, or selected cell range
- Ctrl+Alt+V: Open the Paste Special dialog box
- Delete: Remove the contents of a cell, selected data, or selected cell range
- Alt+Enter: Insert a hard return within a cell (while editing a cell)
- F3: Paste a cell name (if cells are named in the worksheet)
- Alt+H+D+C: Delete column
- Esc: Cancel an entry in a cell or the formula bar
- Enter: Complete an entry in a cell or the formula bar
How to Format Cells using Sage Intelligence is just as easy as in Excel
- Ctrl+B: Add or remove bold to the contents of a cell, selected data, or selected cell range
- Ctrl+I: Add or remove italics to the contents of a cell, selected data, or selected cell range
- Ctrl+U: Add or remove underline to the contents of a cell, selected data, or selected cell range
- Alt+H+H: Select a fill color
- Alt+H+B: Add a border
- Ctrl+Shift+&: Apply outline border
- Ctrl+Shift+_ (Underline): Remove outline border
- Ctrl+9: Hide the selected rows
- Ctrl+0: Hide the selected columns
- Ctrl+1: Open the Format Cells dialog box
- Ctrl+5: Apply or remove strikethrough
- Ctrl+Shift+$: Apply currency format
- Ctrl+Shift+%: Apply percent format

sage 100 analytics, sage 100 bi, sage 100 business intelligence, sage 100 business object interface, sage 100 contractor report writer, sage 100 crystal reports, sage 100 crystal reports training, sage 100 custom reports, sage 100 customization, sage 100 dashboards, sage 100 intelligence reporting, sage 100 power bi, sage 100 report writer, sage 100 reports, sage 100 vs sage 50,